
Beyond Flow Metrics: Turning Flow Data Into Flow Intelligence
Your dashboard shows that Flow Velocity has fallen. Flow Time has increased, and delivery is no longer tracking with the forecast. The signals are visible, but the explanation is not.
Did work items become more complex? Did an external dependency cause delays? Was the ART carrying more work than its available capacity could support? Perhaps priorities changed during the Planning Interval (PI), or a bottleneck formed at a handoff between teams.
A flow metric cannot answer those questions on its own.
Flow metrics provide valuable visibility into how work moves through a system. Flow Intelligence takes the next step: connecting those signals with the work, objectives, dependencies, risks, capacity, and impediments surrounding them.
The distinction matters because seeing a change is not the same as understanding it. Without that understanding, organizations risk responding to symptoms instead of improving the system that produced them.
Flow metrics are the beginning of the conversation
SAFe defines six flow metrics that help organizations examine different aspects of value delivery: Flow Velocity, Flow Time, Flow Efficiency, Flow Load, Flow Distribution, and Flow Predictability.
Together, they help answer important questions:
- How many work items are we completing over time?
- How long does it take work to move through the system?
- How much of that time is spent actively working rather than waiting?
- How much work is currently in progress?
- What types of work are moving through the system?
- How reliably are we achieving our planned outcomes?
These are essential questions. Flow metrics can reveal trends, deviations, and possible constraints that would otherwise remain hidden.
But a signal is not a conclusion.
A decline in Flow Velocity might indicate an impediment. It could also reflect reduced capacity, unexpected technical complexity, changes in the mix of work, or a deliberate investment in architectural work.
An increase in Flow Time might reveal a delay, but it does not tell us whether that delay came from an external dependency, an oversized batch, an approval queue, changing priorities, or interrupted work. Lower Flow Predictability may prompt questions about planning assumptions, unresolved risks, shifting scope, or unexpected events; it does not establish which factor mattered most.
The chart tells us where to look. It does not yet tell us what happened, why it happened, or what we should do next.
For a foundation in the six measures themselves, see our introduction to flow metrics in SAFe.
Why more reporting does not automatically produce more insight
When an organization lacks clarity, the instinctive response is often to add another dashboard, metric, or report. More information can help, but only when it contributes to a meaningful investigation.
A collection of isolated measures can create the appearance of control while leaving the underlying system poorly understood. Teams see that something has changed, leaders request an explanation, and the organization begins searching for someone or something to blame.
That is a dangerous use of flow data.
Flow metrics should help people learn about the system, not evaluate individuals or rank teams. Teams often work under different conditions, with different dependencies, work types, technical environments, and organizational constraints. Comparisons that ignore those differences can mislead decision-makers and discourage the transparency effective improvement requires.
The better response is to treat each meaningful signal as an invitation to ask better questions.
Is this an isolated result or part of a recurring pattern? Where in the system is it happening? Which work items contribute most strongly to it? What changed in the surrounding environment?
Those questions move the conversation from reporting toward intelligence.
Context changes what a flow signal means
Context is the information surrounding a metric that helps people interpret its meaning. Without it, the same signal may support several plausible, and sometimes contradictory, explanations.
Consider Flow Distribution. An ART may find that a greater share of its completed work consisted of enablers and technical-debt items than originally expected.
Viewed alone, that result might appear to show that customer-facing work was neglected. In context, it might reveal a necessary investment in the Architectural Runway, a response to a recurring quality problem, or work required to support an important Strategic Theme.
The signal becomes useful when it is connected to intent.
The same applies to delivery performance. If completed work is falling behind the forecast, teams need more than a percentage. They need to understand planned load, available capacity, scope changes, contributing work items, dependencies, risks, and objectives involved.
Useful context comes from several parts of the system:
- Strategic context: PI Objectives, Strategic Themes, expected business value, and the intended balance between customer work, enablers, improvements, and technical debt.
- Planning context: Capacity, planned load, PI and iteration timing, milestones, estimates, and historical delivery patterns.
- Work context: Item size, type, status, hierarchy, and the teams contributing to delivery.
- Relationship and operational context: Dependencies, handoffs, risks, interruptions, waiting states, and impediments.
This context does not replace the metric. It makes responsible interpretation possible.
From correlation to understanding
Connecting flow metrics with contextual information is an important step, but it does not automatically reveal why a problem occurred. Flow Intelligence requires teams and leaders to investigate relationships, examine alternative explanations, and test their assumptions against the available evidence.
Consider several features with unusually long Flow Time. The metric identifies the outliers, but the opportunity for improvement depends on understanding what happened during their delivery.
Were the features too large? Did they depend on another team or supplier? Were they delayed by procurement, governance, or an approval process? Did urgent work repeatedly interrupt their progress?
The underlying workflow data also deserves scrutiny. If work items were not moved consistently through their states, the apparent delay might partly reflect incomplete or unreliable reporting.
Each explanation suggests a different response. Treating the metric itself as the diagnosis could lead the organization to solve the wrong problem.
Understanding emerges when teams trace the signal back through the work and its surrounding conditions, identify recurring patterns, and look for evidence that confirms or challenges their assumptions.
That investigation is more demanding than reading a chart. It is also where flow data begins to become actionable intelligence.
Impediments connect signals with causes
Impediments are an especially useful source of context because they connect changes in flow with conditions affecting the work.
It is useful to know that Flow Time increased. It is more useful to discover that several delayed features depended on the same external approval process, spent substantial time waiting, and contributed to PI Objectives that delivered less business value than planned.
That level of understanding allows teams to ask whether the problem is local or systemic. It also helps leaders see when a constraint cannot be resolved by a single Agile Team.
A meaningful analysis of impediments might consider their category, duration, affected work, organizational level, impact on delivery, resolution, and recurrence. Over time, this can reveal patterns such as repeated handoff delays, disruptive priority changes, unavailable specialist skills, or slow decision processes.
Not every deviation will have one identifiable cause. Complex delivery systems rarely behave that neatly. Still, making impediments visible gives teams a stronger basis for learning than relying on the chart alone.
It also guards against a common mistake: asking people to work faster when the real constraint is built into the system around them.
Flow Intelligence should lead to action
Understanding a problem is valuable, but it is not the final objective. Flow Intelligence should inform a decision, intervention, or improvement experiment.
The appropriate action depends on what the investigation reveals. A capacity problem might require reducing planned load. Oversized work might need to be split into smaller batches, while a critical external dependency might require coordination beyond the team.
Other findings may lead organizations to:
- Reduce concurrent work.
- Resequence work around a dependency.
- Clarify PI Objectives.
- Protect capacity for enablers or technical debt.
- Remove an unnecessary approval or handoff.
- Address a recurring organizational bottleneck.
- Adjust future planning assumptions.
Not every fluctuation requires action. Teams must distinguish meaningful patterns from normal variation and avoid reacting impulsively to a single data point.
When action is appropriate, treat it as a learning opportunity. Form a hypothesis, make a bounded change, and observe the signals that follow.
Did Flow Time improve after work items were made smaller? Did predictability improve after dependencies were identified earlier? Did reducing work in progress help items move through the system more consistently?
This creates a continuous learning loop:
Signals → Context → Understanding → Action → New Signals
The purpose of measurement is not to produce a perfect dashboard. It is to help the organization learn whether its decisions improve the flow of value.
A practical model for Flow Intelligence
Organizations can apply Flow Intelligence by working through four stages: Signals, Context, Understanding, and Action.
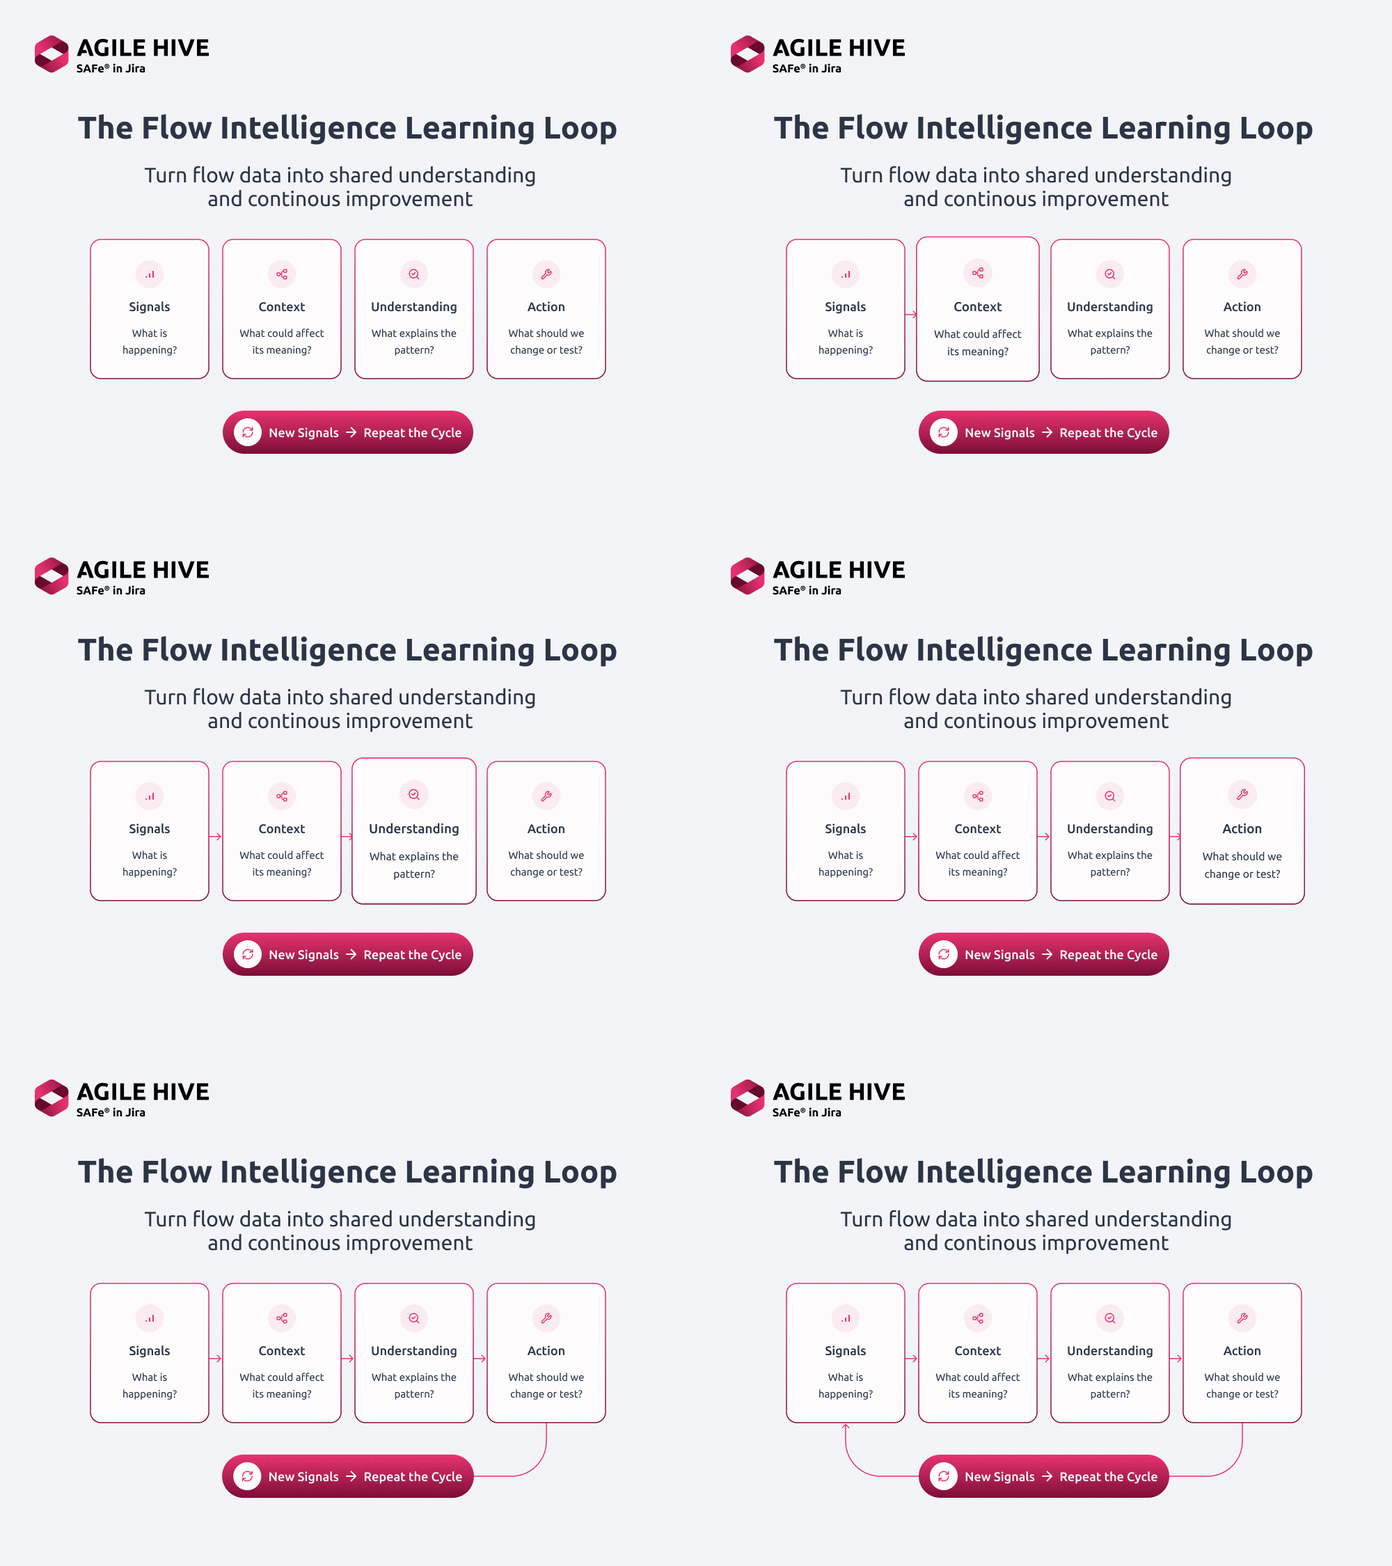
Consider a hypothetical ART experiencing longer Flow Time across several features during a PI. The dashboard reveals a change, but understanding what caused it requires looking beyond the metric.
1. Signals: What appears to be happening?
Begin with a meaningful observation. It might come from a formal flow metric, a burnup forecast, planned versus completed work, dependency criticality, risk exposure, or another delivery indicator.
In our example, Flow Time has increased across several features. Rather than immediately concluding that teams are working too slowly, the ART identifies the change as something worth investigating.
The goal at this stage is not to explain the result. It is to recognize what deserves attention.
2. Context: What could affect its meaning?
Connect the signal with the work and its surrounding conditions. Examine capacity, scope, hierarchy, objectives, business value, milestones, dependencies, risks, impediments, and changes that occurred during execution.
The ART discovers that several affected features share an external dependency. Their work histories also show repeated delays while waiting for approval.
That context narrows the possible explanations. The increase in Flow Time may have less to do with team execution and more to do with a constraint outside the teams’ direct control.
3. Understanding: What evidence best explains the pattern?
Investigate the contributing work, look for recurring conditions, and test alternative explanations against the available evidence.
The ART compares affected features with similar work that did not require the external approval. It examines waiting periods, dependency timing, and whether the same delays occurred across multiple teams.
The evidence suggests that the approval process is contributing to longer Flow Time.
This is an important distinction. The metric identified the problem, but the investigation revealed a plausible systemic constraint. The ART now has a stronger basis for deciding what to change.
4. Action: What should we change or test?
Choose an intervention appropriate to the evidence. That might involve adjusting a plan, coordinating a dependency, removing an impediment, changing a policy, or running an improvement experiment.
In our example, the ART works with the external provider to address the approval bottleneck and coordinates future dependencies earlier in the planning process.
It then monitors subsequent delivery patterns to determine whether the intervention reduces waiting time and improves Flow Time.
If the expected improvement does not occur, the ART revisits its explanation rather than assuming the original diagnosis was correct.
The result is a continuous learning loop:
Signals → Context → Understanding → Action → New Signals
Flow Intelligence is not about reaching a final answer from a dashboard. It is about developing better explanations, making informed changes, and learning from the results.
Applying the model in SAFe events
Flow Intelligence does not require another meeting. It can strengthen the events and conversations already used by Agile Teams and ARTs.
During PI Planning, historical flow signals can provide a sanity check on proposed commitments. Capacity, dependencies, work distribution, and PI Objectives add the context needed to determine whether a plan is realistic and aligned with strategic intent.
During the ART Sync, participants can examine changing delivery signals alongside dependencies, risks, and impediments. This helps distinguish between a problem that an individual team can address and one requiring ART-level coordination.
During the System Demo, teams can connect completed work with delivered value and objectives. The conversation can cover not only what was delivered but also what the delivery process revealed about the system.
During Inspect and Adapt, participants can select a meaningful signal, investigate its context, identify a systemic problem, and define an improvement experiment whose effects can be evaluated during the next PI.
At the portfolio level, the same thinking can help leaders assess whether value delivery aligns with strategic priorities and expose constraints arising from investment decisions, organizational policies, or dependencies spanning multiple value streams.
How Agile Hive contributes to Flow Intelligence
The practical value of Flow Intelligence depends on being able to connect delivery signals with the work, plans, and relationships that give those signals meaning. Agile Hive supports that investigation by bringing SAFe planning structures and related delivery information together within Jira.
Agile Hive Cloud reports and views provide indicators such as burnup, historical velocity, completed versus planned Story Points, planned load versus capacity, dependency criticality, risk exposure, and planned versus actual business value.
These indicators are not all equivalent to the six SAFe flow metrics. Story Point velocity, for example, is not the same calculation as Flow Velocity, and planned load versus capacity is not the same as Flow Load. The value lies in examining the available indicators alongside the context of the work.
That context includes:
- Work-item hierarchies and team and ART contributions.
- Planning Intervals, iterations, and milestones.
- PI Objectives and business value.
- Risks and internal and external dependencies.
- Roadmap and team-planning dates.
The Dependency Overview Widget offers a useful example. It identifies the provider and consumer of a dependency, distinguishes internal from external dependencies, evaluates timing against the plan, and indicates whether the relationship is healthy, at risk, critical, or resolved.
That information moves users beyond a raw dependency count. They can investigate which work is affected, understand timing conflicts, and coordinate an appropriate response.
Progress information becomes more meaningful in the same way. The Burnup Chart shows planned scope, completed Story Points, ideal progress, and a forecast. Examined alongside PI progress, capacity, objectives, risks, and contributing teams, it can support a richer conversation about what is happening and why.
Agile Hive does not automatically diagnose the causes of flow problems or replace the judgment and conversations needed to improve them. It helps practitioners investigate delivery signals alongside relevant planning and organizational context, supporting more informed decisions across teams and ARTs.
Avoiding common Flow Intelligence traps
Moving from metrics to intelligence requires discipline. Several habits can undermine it.
Treating a signal as proof. A metric may justify investigation, but it rarely establishes causation on its own.
Optimizing one measure in isolation. Increasing throughput at the expense of quality, sustainability, business value, or predictability does not necessarily improve the overall flow of value.
Optimizing locally. One team can become more efficient while shifting delays or additional work to another part of the system.
Ignoring data quality. Flow Efficiency and other workflow-based analyses depend on consistent work-item status information. Conclusions drawn from incomplete or poorly maintained data deserve caution.
Stopping at explanation. If understanding never leads to a decision, experiment, or systemic improvement, Flow Intelligence becomes another form of reporting.
Move from reporting flow to improving it
Flow metrics are indispensable. They make trends, deviations, and possible constraints visible, giving organizations a way to examine how effectively value moves through their system.
But the metric is the beginning of the conversation.
Flow Intelligence comes from connecting those signals to the work being delivered, the outcomes it supports, available capacity, and the dependencies, risks, and impediments surrounding it. That connection helps teams and leaders develop better explanations, make more informed decisions, and learn whether their actions actually improve the system.
A simple way to begin is to choose one meaningful flow signal and ask four questions:
- What is the signal telling us?
- What context could change its meaning?
- What evidence would help explain the pattern?
- What decision or improvement experiment should follow?
Flow metrics help organizations see the movement of value. Flow Intelligence helps them understand and improve it.
Ready to connect delivery signals with the planning context behind them? Explore Agile Hive to see how shared visibility into objectives, dependencies, risks, and progress can support more informed improvement conversations.